The Matrix Moment: Choosing Your Reality with Agentic AI
.png)
Deep Dive into Unity Catalog: Your Trusted Governance Layer

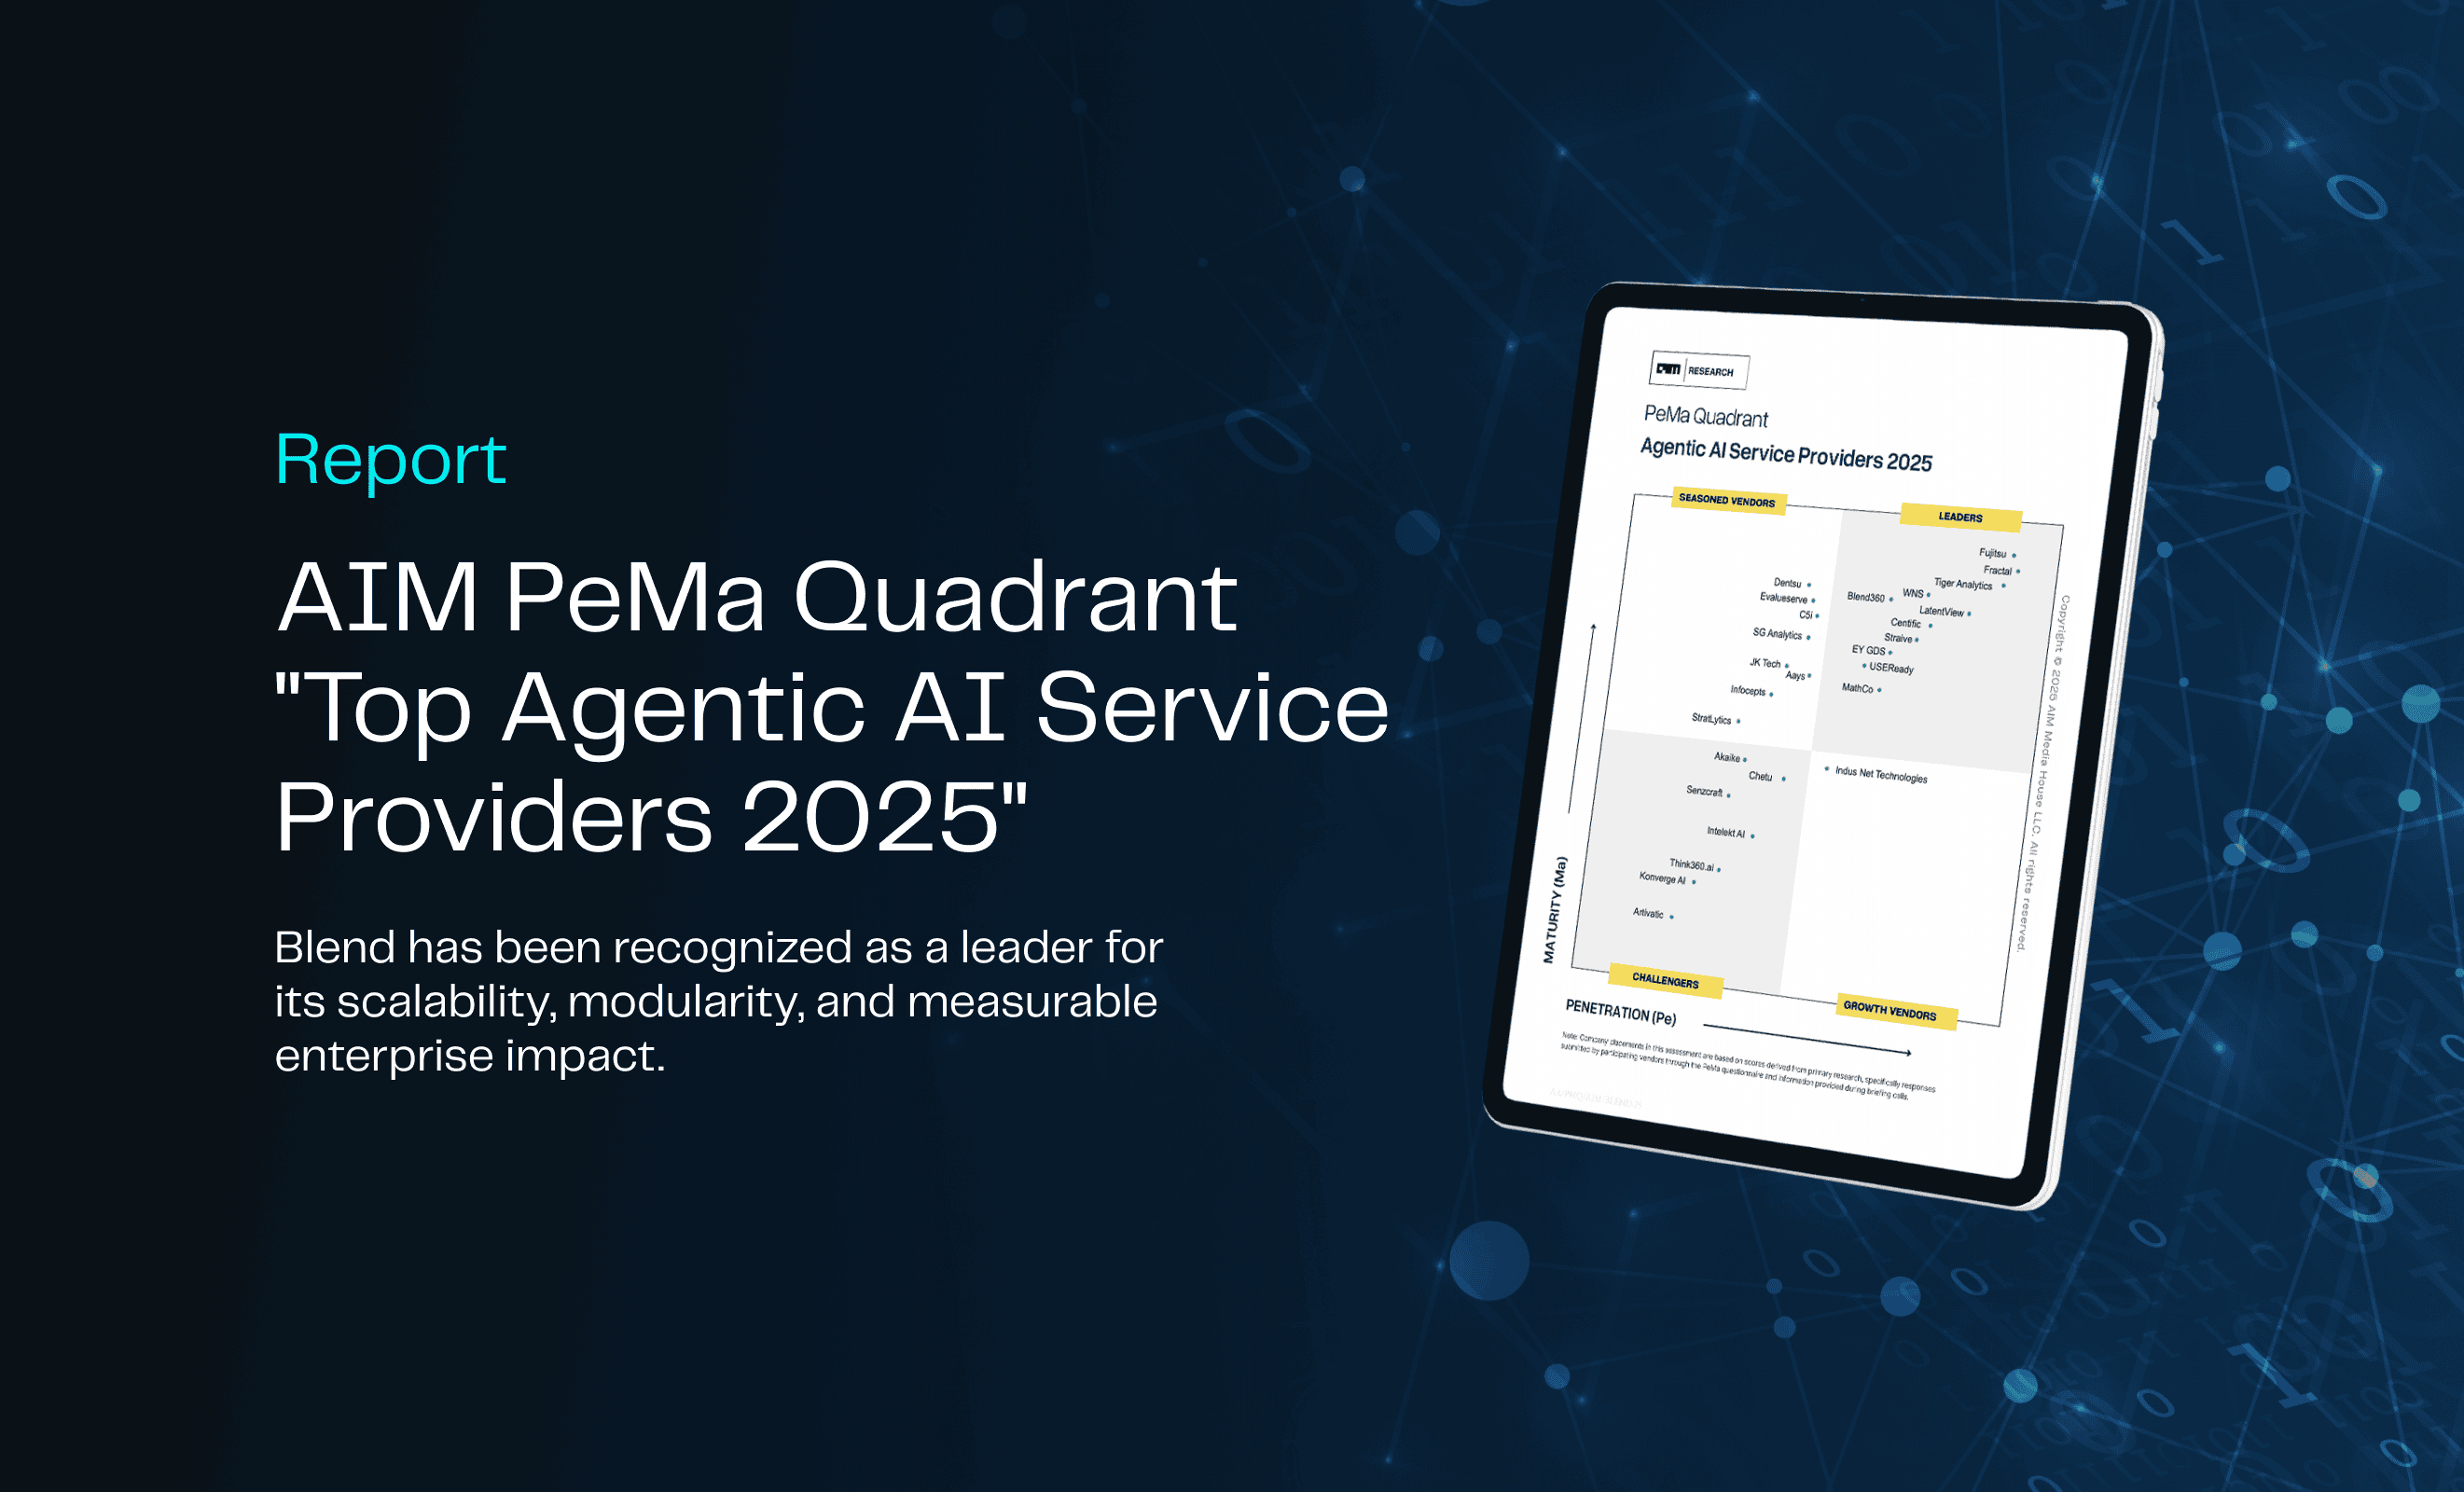
Blend Powers Agentic AI Revolution with 80% Success Rate in AIM Research’s Top Service Providers 2025 Report
%20(1).png)
Beyond Transactions: How AI Is Writing the Future of Payments

The Marketing Revolution I’ve Witnessed: From Predictive Dreams to Generative Reality

From Insight to Impact: Align Your Analytics with Real Business Goals

From Dashboards to Decision Engines: Climbing the Gen BI Maturity Curve

eBook | Bridging the Gap: The Dual Path to Digital Transformation in Energy

AI-Powered Revenue Generation: Applying the Critical 7 Framework in Technology and Media
.png)
Beyond Dashboards: Unlocking Supply Chain Insights with Conversational AI
.png)
From Bottleneck to Breakthrough: Transforming AI Approvals in Financial Services
.png)
Scaling AI with Confidence: The Critical 7 to Get It Right

The Death of the Customer Journey: Why AI Demands a New Model for Experience Design
.png)
eBook | The Critical 7: Strategies for Scaling AI
%2520(1).png)
AI in Supply Chain: Moving Beyond Prediction to Automation & Trust

Shaping the Future: The Role of GenAI in the BI Initiatives of Tomorrow

The Great Wealth Management Reset: Leading in the Age of AI

The Analyst of the Future: How AI is Transforming Talent in Financial Services
%2520(1).jpeg)
From Legacy to Leadership: Modernizing Financial Data for AI Success
534%2520-%2520Download_Page-banner-%2520Thumbnail.png)
Report: AIM Research Top Generative AI Service Providers
.jpeg)
The Future of CPG Label Compliance: How GenAI is Transforming Label and Ingredient Management

CDAO Longevity in the AI Era: Proving Impact & Leading Change
.jpeg)
AI as an Ally: Building Trust to Empower Your Workforce

Operationalizing AI: From POCs to Practice
.jpeg)
From Hype to Reality: Navigating the Nuance of Early AI Adoption

Accelerating Data Democratization with Databricks’ Unity Catalog
.jpeg)
Changing the Game: How AI is Transforming Scouting in Professional Football
.jpeg)
The Dangers of Solution Productization: Considerations When Choosing an AI Services Partner

Kindling the AI Spark: From Experiments to Enterprise Initiatives
%2520(1).png)
The Data Democratization Dilemma: Unlocking Potential, Managing Risk
.jpeg)
The Cookie-Limited Future

From Fragmented to Formidable: Building an AI-Ready Data Ecosystem
.jpeg)
Beyond Features: How Databricks’ AI/BI Release Signals a Shift in Data Strategy

E-Book: Data Democratization
%2520(1).jpeg)
Exploring Snowflake Arctic: The Open-Source LLM for Enterprises

Detecting Brand-Unsafe Content Through Computer Vision

AI Decisioning: 3 Key Considerations for Successful Application

Navigating the EU AI Act: Business Impact and Considerations

Blazing the AI Revolution: How to Ignite a Culture of AI by Blending Data, Tech, and People

Internet-Accessible ElastiCache Server Behind Twemproxy, Using NLB and ASG
.jpeg)
Transforming Healthcare by Unleashing Data’s Hidden Potential
.jpeg)
Data and Wearables: How AI is Reshaping Healthcare as We Know It

The Cookieless Future: What Google Chrome's Third-Party Cookie Phaseout Means for You

UMM: Success Strategies, Optimization & Validation

Impact Players: Looking at Life Through Opportunity Goggles

Precision Targeting: Mass Marketing to Individualization

Navigating CDP Readiness in an Era of AI and Dynamic Personalization

First Steps Towards Building Reactive Microservices with Modern Java

Data Strategy and Technology Architecture - The Unsung Heroes of Generative AI POC to Production

How to Avoid the 2-Year Club

Implementing and Deploying a Cloud Native Full Stack Application

Orchestrating an ML Workflow with Step Functions and EMR

Navigating Apple's Latest Privacy Update: Implications for Measurement and Tracking

Fine-Tuning a Vision Transformer

The Personalization Maturity Model: Building Tailored Experiences for Every Customer

Launching an EMR cluster using Lambda functions to run PySpark scripts part 2: The infrastructure and launch

Development of AI-powered Ecosystem for Better HCP Marketing Results

Maximize your BI Migration - The Blend360 Approach

ChatGPT's Implications for the NLP Community: Don't Panic...Yet!

Launching an EMR Cluster Using Lambda Functions to Run PySpark Scripts Part 1: The Spark Scripts

AI Demystified: A Business Leader's Guide to Understanding Artificial Intelligence

Demystifying GA4 for Businesses
.jpeg)
QuickSight Q, Insights and Forecast

Using Artificial Intelligence and Machine Learning for Better ID Resolution

A Data-Driven Analysis of the Gender Gap in the Tech Industry

What I Learned About GraphQL While Developing a Shopify App (Part 2)
.jpeg)
An Introduction to GraphQL: Lessons from Developing a Shopify App (Part 1)

Trends to Keep an Eye Out for in 2023 After AWS re:Invent

10 Essential Power BI Resources

Building a Big Data Processing Pipeline – Chapter 4

The Environmental Impact of Advancements in Data Science

Building a Big Data Processing Pipeline – Chapter 3

Building a Big Data Processing Pipeline – Chapter 2

Building a Big Data Processing Pipeline – Chapter 1

Lessons from Agile: It's not just for software anymore

A Sequel Better Than the Original: How a Return to Media Measurement Roots will be Different

Seven Aspects to Successfully Implement a CI/CD Pipeline

The Beautiful Marriage of SEO and Data Science

8 Features Of Adobe Target You Never Knew You Needed

The Power Of Blending First And Third-Party Data Sources

Metadata Matters

Navigating the Complex Third-Party Data Landscape
.jpeg)
Machine Learning, what is it, and how is ML different from AI?

Learn and Confirm: Why it's Better than Test and Learn

Data Explosion & Industry Trends

Building a Killer Data Science Team... What 2021 Taught Us And Why We Are Excited About 2022

Bringing a Strategic Element to Data Science

Five Keys to Powering Growth with Data Science

Reach The Always-On Consumer

Winning Strategies for Online Grocery Shopping

Taking Your BI Dashboards to the Next Level

A Glance Into the Online Grocery World

Common Pitfalls When Building Smart Data Products That Leverage Machine Learning

Measuring Friction in Customer Experience
